
PHP デバッグ方法(XAMPP/Eclipse/Xdebug)
Xdebugモジュール
ダウンロード
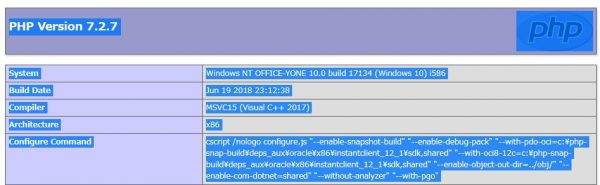
phpinfo()を出力
↓
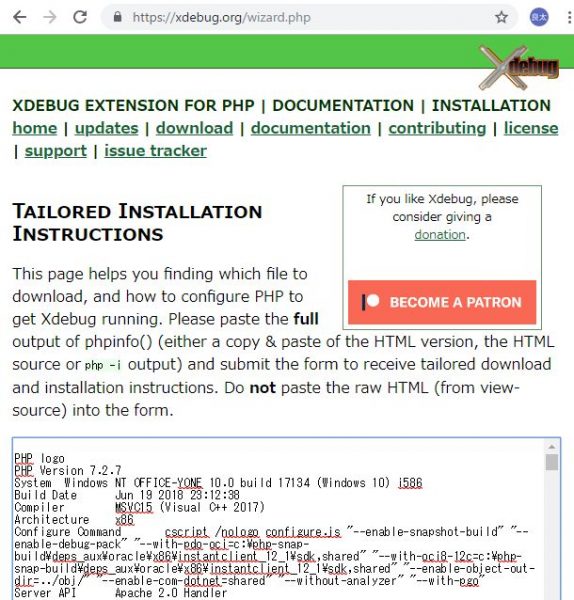
https://xdebug.org/wizard.php
のテキストエリアにphp_info()の出力結果を貼り付け
↓
「Analyse my phpinfo() output」ボタン押下
↓
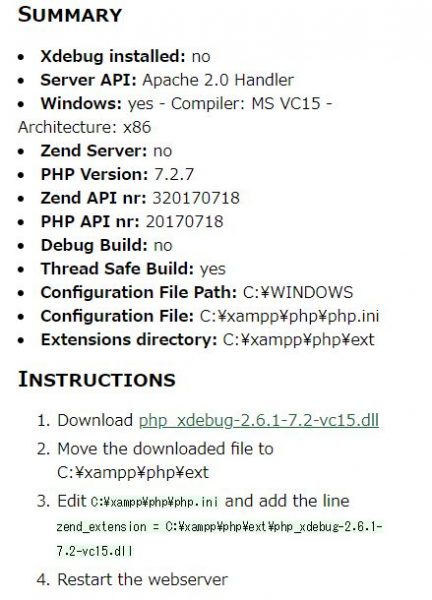
分析されたモジュールをダウンロード
例:php_xdebug-2.6.1-7.2-vc15.dll
保存
C:\xampp\php\ext\
に保存
XAMPP
読み込み
C:\xampp\php\php.ini
に以下を追加
[XDebug]
;; Only Zend OR (!) XDebug
zend_extension_ts=”C:\xampp\php\ext\php_xdebug.dll”
xdebug.remote_enable=true
xdebug.remote_host=127.0.0.1
xdebug.remote_port=9000
xdebug.remote_handler=dbgp
xdebug.profiler_enable=1
xdebug.profiler_output_dir=”C:\xampp\tmp”
Eclipse
デバッグの構成
サーバータブ
「PHP Webアプリケーション」をダブルクリック
名前を保存可能
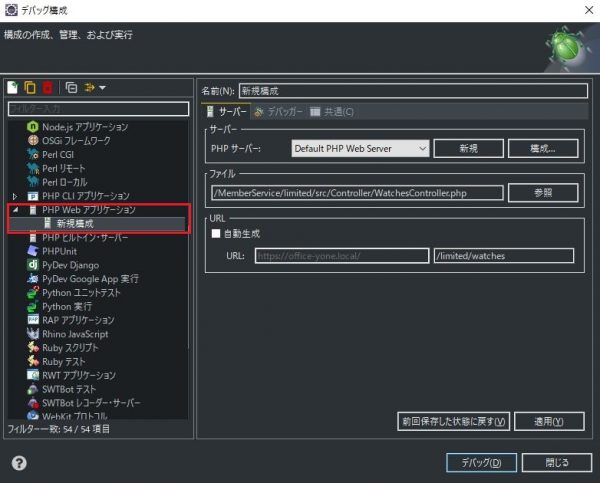
ファイル:デバッグ対象のファイルを選択
URL:CakePHPの場合、URLが実ファイルと変更されるのでブラウザに表示されるURLを入力
サーバー:構成
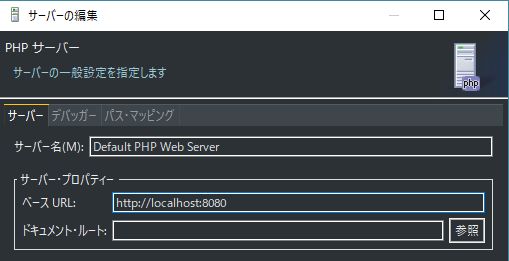 ベースURL:ポート番号等変更がある場合
デバッガータブ
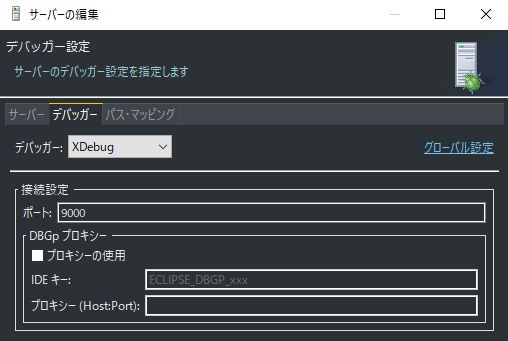
デバッカー:XDebugを選択